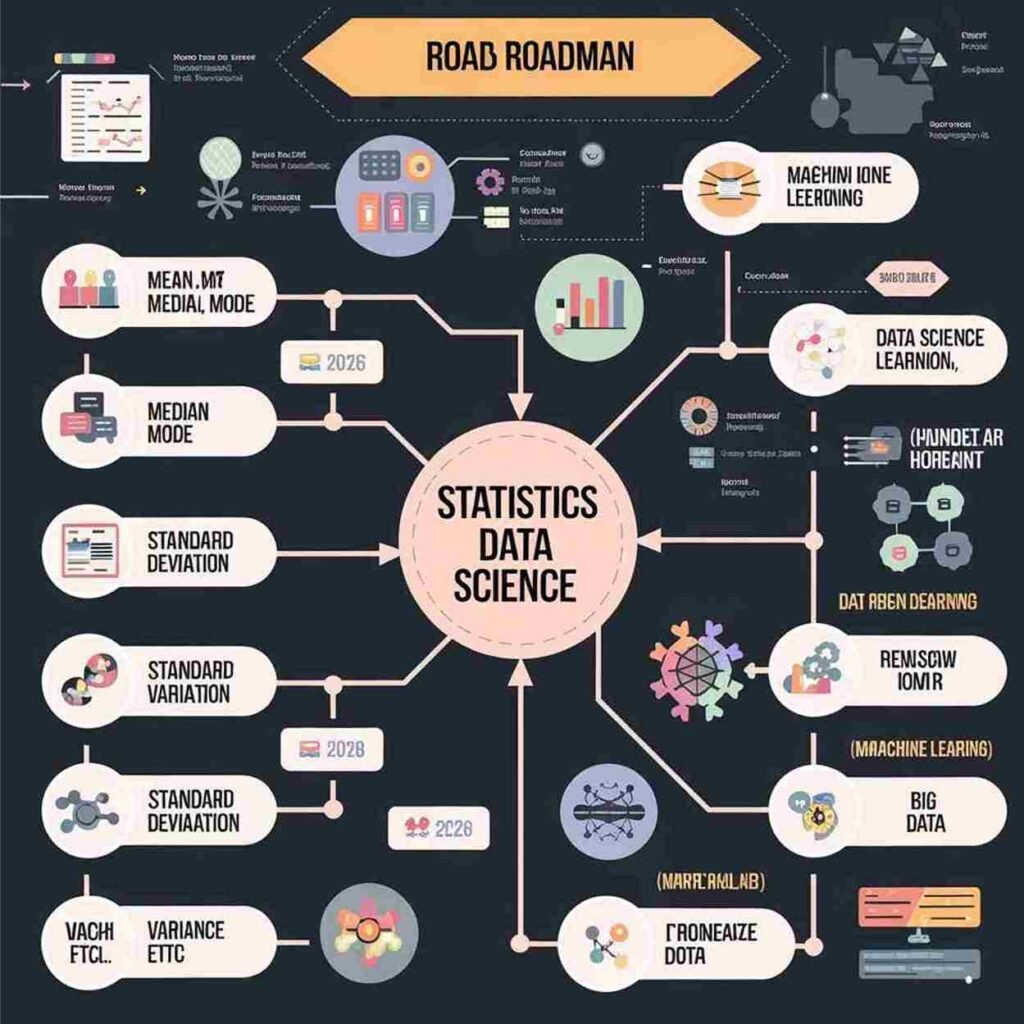
This roadmap gives an in-depth understanding of statistics for data science, covering everything from basic descriptive statistics to complex regression analysis. Following the structured approach outlined here will help build a strong foundation in statistics, essential for mastering data science.
![](https://datainjector.com/wp-content/uploads/2024/07/WhatsApp-Image-2024-04-132-at-20.26.16_e7719b38.jpg)
Sazit Suvo
Designer & editor
Introduction to Statistics
- What is Statistics?
- Sample vs. Population Data
- Understanding the Difference Between a Population and a Sample
Descriptive Statistics
- Fundamentals of Descriptive Statistics
- Types of Data in Statistics
- Categorical Data
- Numerical Data
- Ordinal Data
- Levels of Measurement
- Nominal, Ordinal, Interval, and Ratio
Visualizing Data
![Statistics for Data Science Roadmap](https://datainjector.com/wp-content/uploads/2024/10/data-python_4_11zon-1024x1024.jpg)
- Categorical Variables
- Visualization Techniques for Categorical Variables (Bar Charts, Pie Charts)
- Exercise: Categorical Variables Visualization
- Numerical Variables
- Using a Frequency Distribution Table
- Exercise: Numerical Variables Visualization
- Histogram Charts
- Exercise: Create a Histogram
- Cross Tables and Scatter Plots
- Understanding Relationships Between Variables
Measures of Central Tendency, Asymmetry, and Variability
- Mean, Median, and Mode
- Exercise: Calculating Mean, Median, and Mode
- Measuring Skewness
- Exercise: Measuring Skewness
- Measuring Data Spread: Variance and Standard Deviation
- Variance Exercise
- Standard Deviation and Coefficient of Variation
- Covariance and Correlation
- Exercise: Covariance
- Correlation Coefficient
Practical Example of Descriptive Statistics
Distributions and Inferential Statistics
Introduction to Distributions
- What is a Distribution?
- The Normal Distribution
- The Standard Normal Distribution
- Exercise: Standard Normal Distribution
Central Limit Theorem
- Understanding the Central Limit Theorem
- Standard Error
Estimators and Estimates
- Working with Estimators and Estimates
- Confidence Intervals
- Calculating Confidence Intervals Within a Population (Known Variance)
- Exercise: Confidence Intervals
T-Distribution and Confidence Intervals
- Student’s T-Distribution
- Calculating Confidence Intervals With Unknown Population Variance
- Exercise: T-Distribution and Confidence Intervals
- Margin of Error: What It Is and Why It’s Important
- Confidence Intervals for Two Means (Dependent and Independent Samples)
- Exercise: Confidence Intervals for Dependent and Independent Samples
Hypothesis Testing
Fundamentals of Hypothesis Testing
- Null vs. Alternative Hypotheses
- Rejection Region and Significance Level
- Type I vs. Type II Errors
- Test for the Mean (Known and Unknown Population Variance)
- Exercise: Hypothesis Testing for Population Means
- Understanding the p-value and Its Importance in Statistics
- Exercise: p-value Calculation
- Testing Means for Dependent and Independent Samples
- Exercise: Testing for Independent Samples
Regression Analysis
Introduction to Regression Analysis
- Correlation and Causation
- The Linear Regression Model
- Correlation vs. Regression
- Geometrical Representation of Linear Regression
- Practical Example: Reinforcement Learning
- Decomposing the Linear Regression Model
- R-Squared and Its Role
- Ordinary Least Squares (OLS)
- Practical Applications of OLS
- Regression Tables and Their Interpretation
- Exercise: Studying Regression Tables
Multiple Linear Regression
Understanding the Multiple Linear Regression Model
- Adjusted R-Squared
- F-Statistic and Its Significance
- Exercise: Multiple Linear Regression
Assumptions for Linear Regression Analysis
OLS Assumptions
- A1: Linearity
- A2: No Endogeneity
- A3: Normality and Homoscedasticity
- A4: No Autocorrelation
- A5: No Multicollinearity
- Dealing With Categorical Data